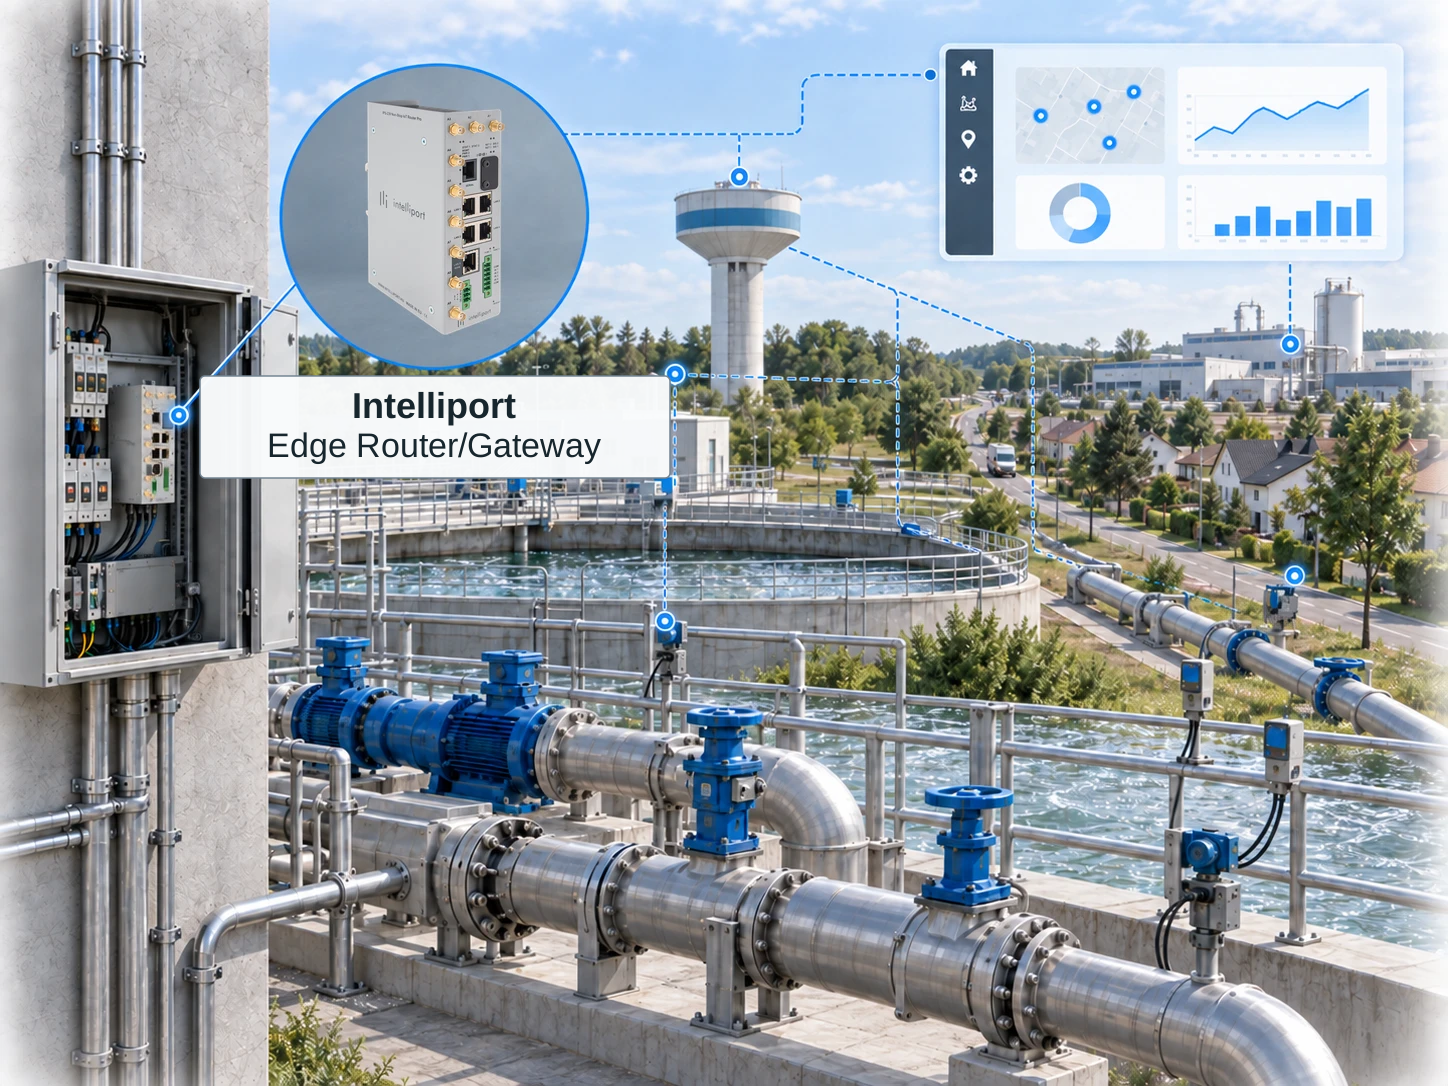
From measurement to targeted intervention
Water loss, pressure and energy use are interconnected. Each of the five solutions can be introduced separately, while a shared data-collection and supervision layer provides a more complete operational view.
The goal is not another data interface, but understanding where intervention is justified, what form it should take, and then measuring the resulting change
Network water loss
Intervene where water is being lost
District water balances show which part of the network needs attention comparing data from before and after an intervention also reveals how much water the repair recovered
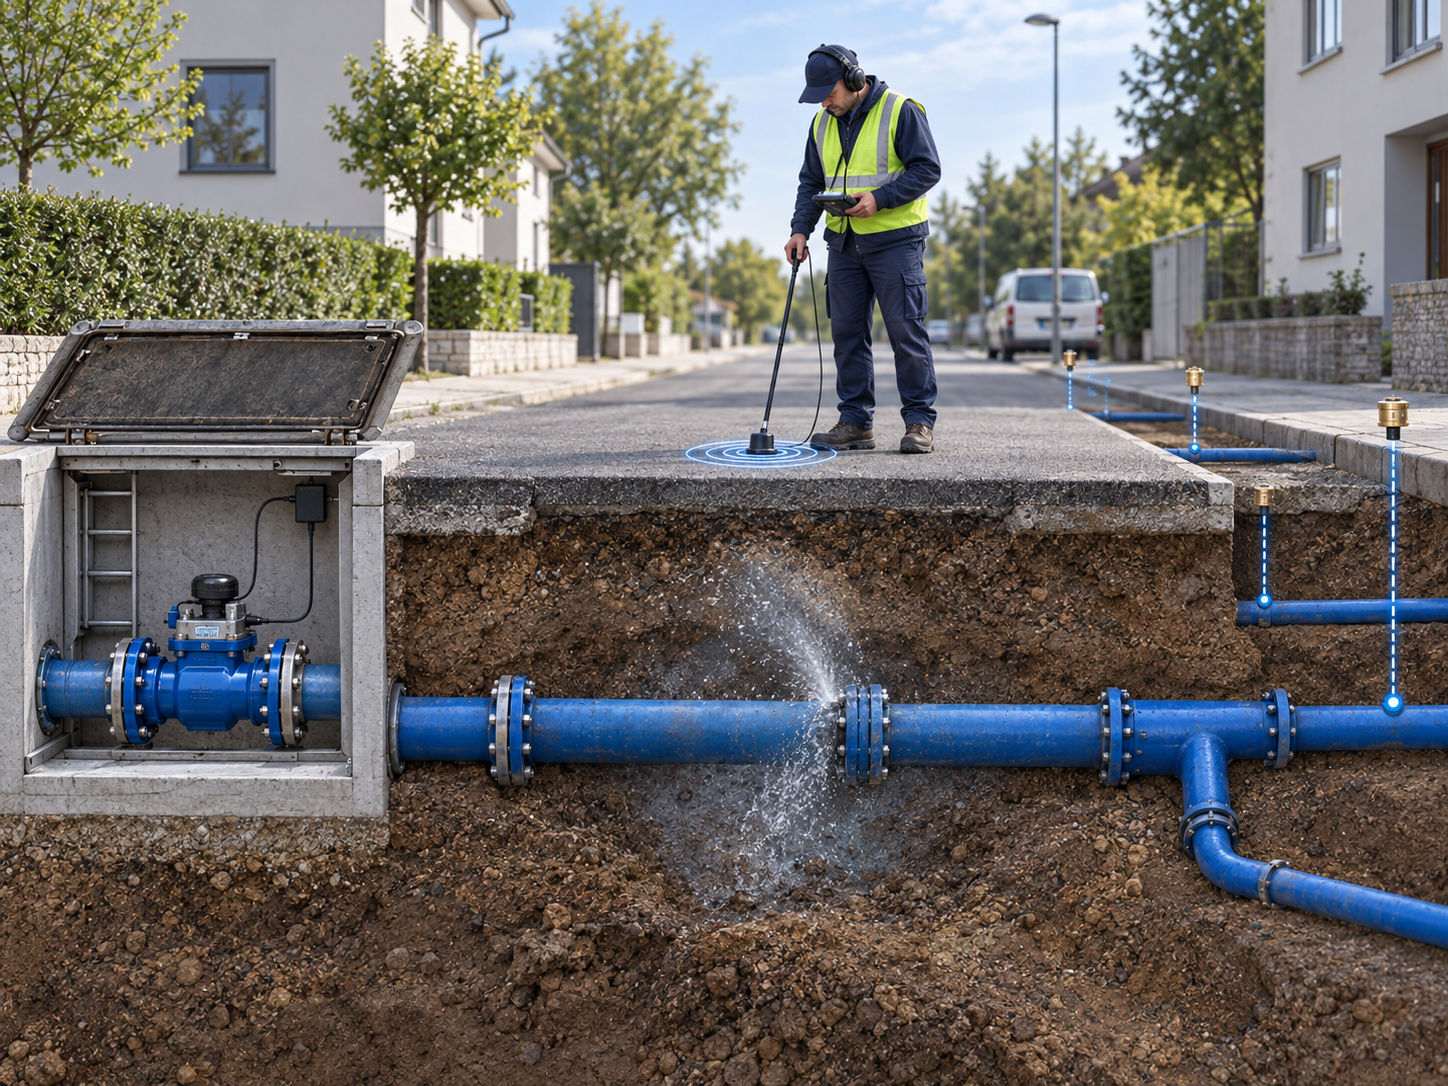
Where should water loss be investigated?
District water balanceThe variance and minimum night flow together help target the field investigation.
A variance is not automatically a leak: measurement, accounting and timing causes must also be checked.
What do we measure?
- Supplied and delivered water volumes; district inflow and outflow.
- Minimum night flow, network pressure and reservoir level.
- Meter pulses, register values, timestamps, data quality and connection status.
How do we use the data?
- District water balance and map-based overview.
- Alerts for suspected leakage and abnormal consumption.
- Periodic water-loss reports, GIS and enterprise exports, and before-and-after comparison.
Targeted investigation · Early warning · Measurable repair results
Remote reading for high-consumption sites
See daily operation instead of a monthly reading
Hourly data from industrial plants, institutions, residential developments and agricultural consumers improves the network water balance persistent night-time base consumption may also reveal losses within the consumer’s own network
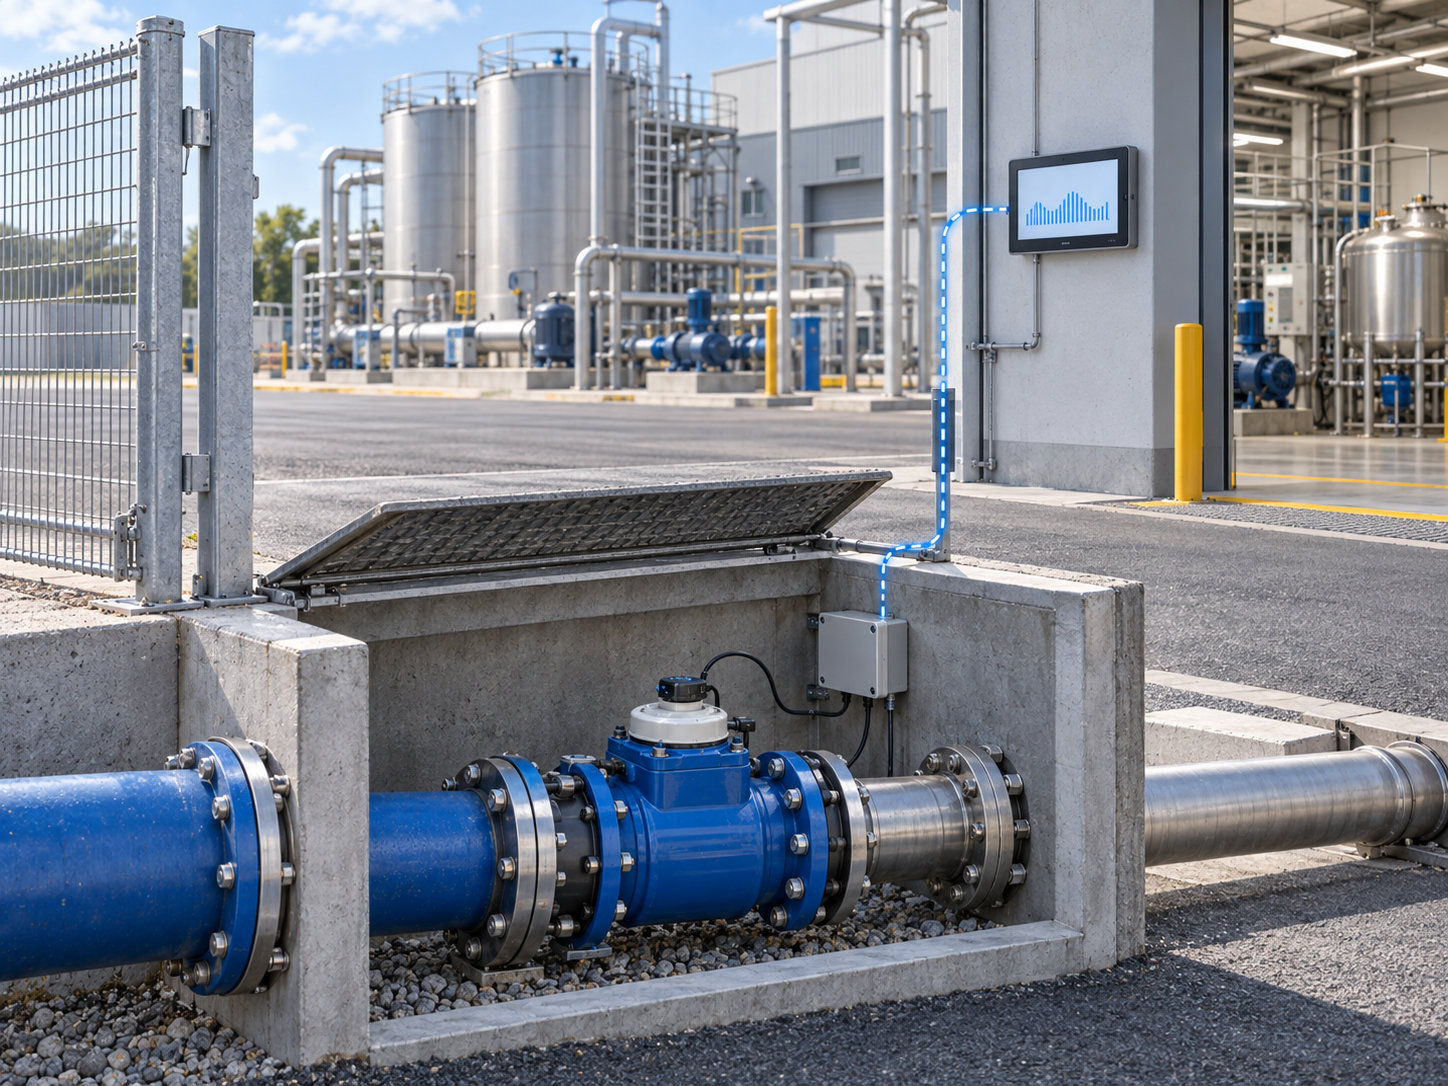
Consumption patterns reveal anomalies
Illustrative daily profileConsumption peaks, persistent night use and changed operating patterns can be investigated separately.
For a complete non-leap-year data set.
What do we measure?
- Meter reading and hourly consumption by measurement point.
- Night-time minimum, peak load and consumption profile.
- Depending on the device: reverse flow, blockage, tampering, battery level and signal strength.
How do we use the data?
- Automatic consumption log and export without manual re-entry.
- Alerts for changes and anomalies in consumption patterns.
- Comparison with district supply and integration with the billing system.
More detailed water balance · Fewer site readings · Data-supported anomaly resolution
Pressure management
Maintain the pressure required reduce the excess
Excessive network pressure can increase background leakage, burst risk and pumping energy demand Zone-level measurement and analysis supports intervention while accounting for supply pressure at critical points
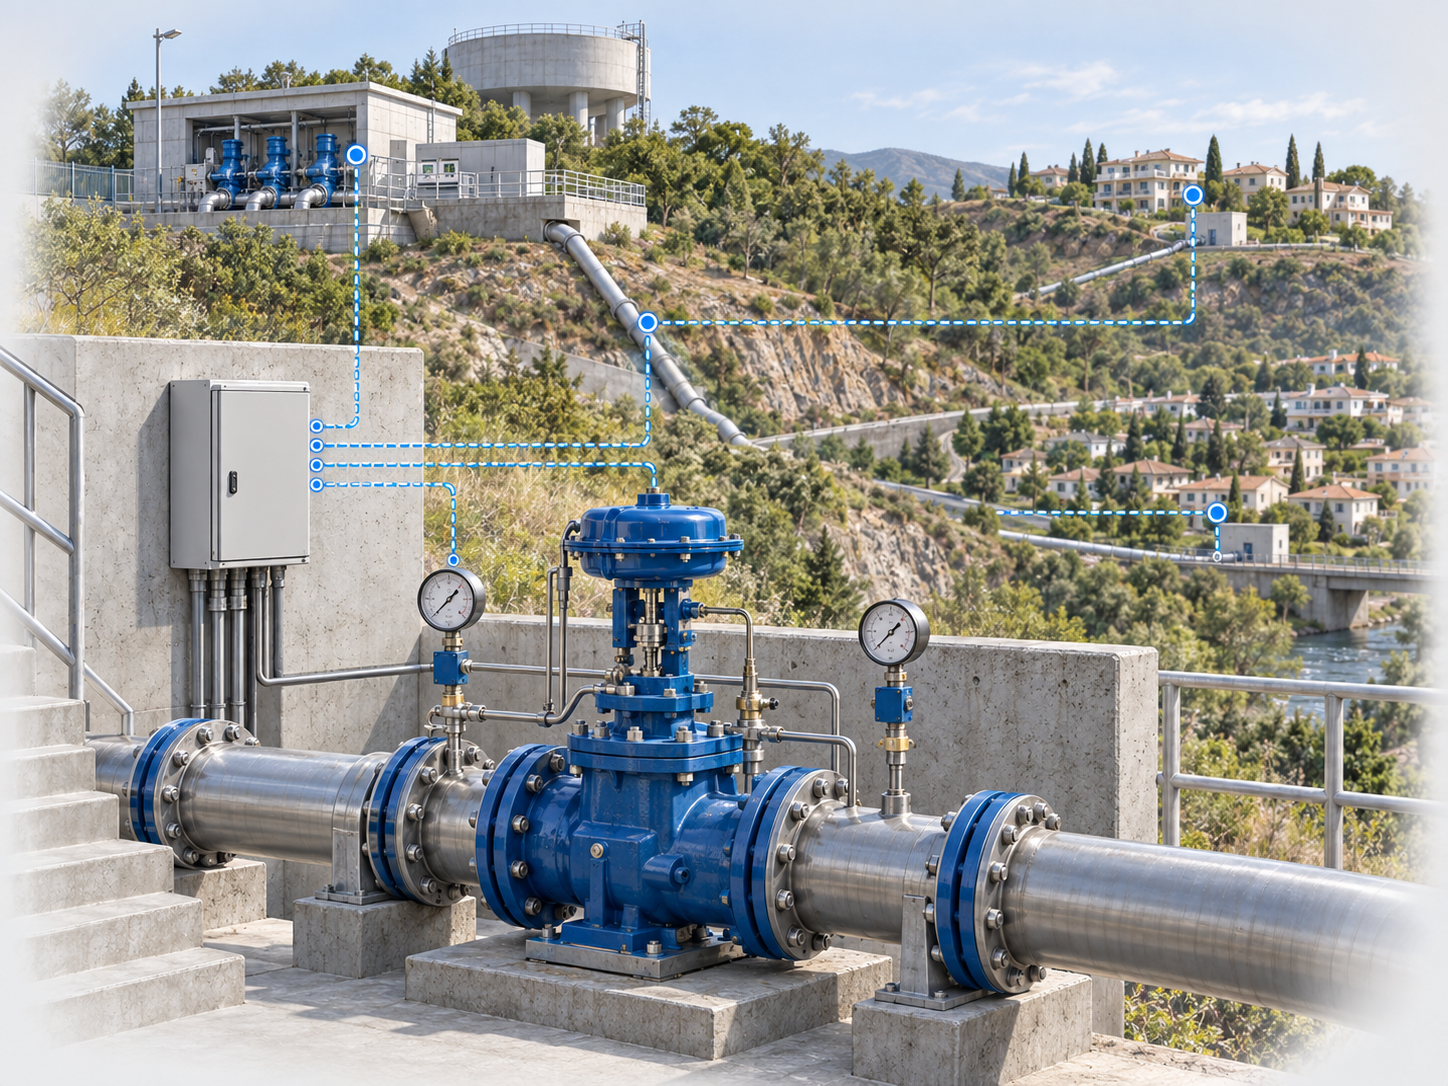
Control is completed by measuring the result
Pressure managementProtection functions remain in the local control system.
The system alerts and recommends; operations decide on intervention.
Supervised control
The system intervenes only within the approved control scope and limits.
What do we measure?
- Operating pressure at critical points; district inflow and outflow.
- Pressure-reducing valve position and setpoint, pump status and speed.
- Reservoir levels, pressure transients and daily peaks.
How do we use the data?
- Supervision and decision support: measurement, alerts and recommendations; operations decide on intervention.
- Supervised or automatic control: adjusting setpoint, speed and reservoir filling within approved limits.
- In both cases, local protection functions remain in the local control system.
Lower pressure loading · Critical supply points considered · Two implementation levels
Remote facility supervision
Different sites one shared supervision layer
Data from wells, plant rooms, reservoirs, booster stations and network chambers can be organised into one shared collection layer supporting water-loss, pressure and energy supervision
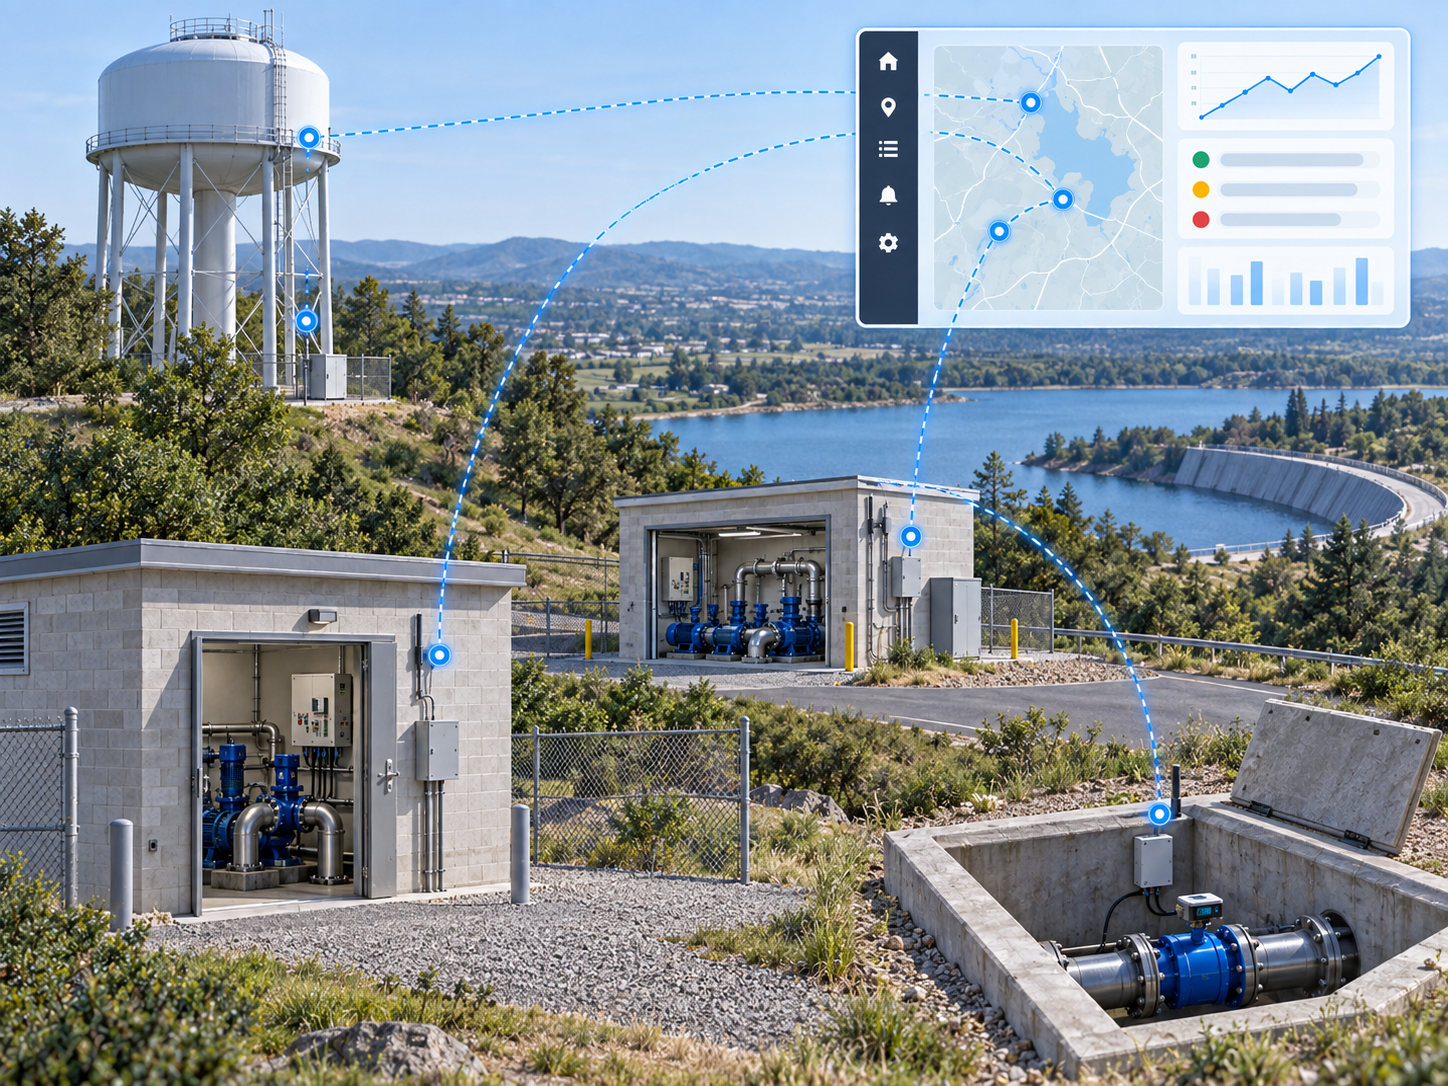
A shared data path for different sites
Supervision architectureLocal gateway
Protocol integration
Data validation
Local buffering
Central supervision
- Time series and data quality
- Events and alerts
- Remote device management
What do we measure?
- Pressure, flow, water level, pump status and electrical power.
- Motor current, drive status, valve position, door opening and intrusion alerts.
- Power-supply and network status, fault and emergency signals.
How do we use the data?
- Protocol integration, local data buffering and secure connectivity.
- Device management, remote configuration, and site status and alert views.
- Time series with data-quality handling, SCADA/GIS integration, reporting and audit trail.
Reusable infrastructure · Alert-driven site visits · Local data buffering
Energy and pump operation
See more than energy consumption see efficiency too
Electrical submetering supports operations when interpreted together with delivered water volume and pump operation the kWh/m³ indicator makes sites comparable and technical interventions measurable
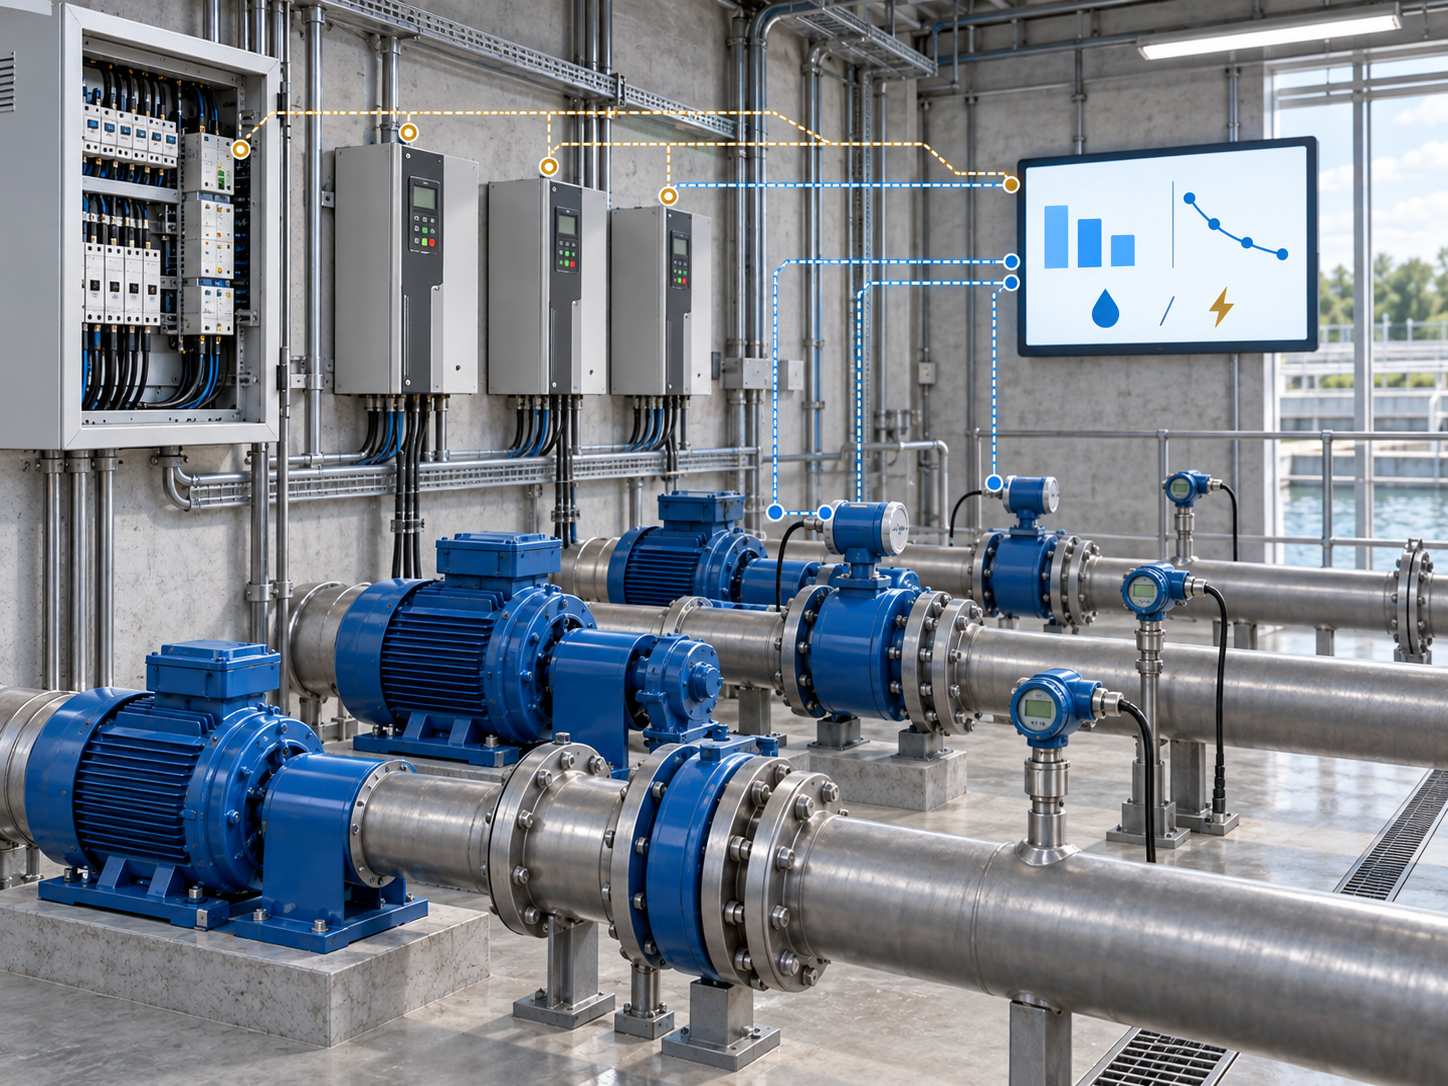
How much energy is needed for the same amount of water?
Specific energy · kWh/m³Electrical energy and delivered water together reveal specific consumption.
Compare under equivalent operating conditions.
What do we measure?
- Electrical power and energy, motor current and power factor.
- Operating hours and starts per pump, and variable-frequency-drive frequency.
- Delivered water volume and suction- and discharge-side pressure.
How do we use the data?
- Specific energy use and efficiency trends; comparison between sites.
- Analysis of pump combinations, start sequence and electrical peak load.
- Reservoir-level-based scheduling; plan-versus-actual and before-and-after reporting.
kWh/m³-based assessment · Targeted technical intervention · Verifiable change
A shared data path, tailored to the site
- Field measurement water-volume, pressure, energy and status data required for the task.
- Local data collection protocol integration, data validation and buffering.
- Secure connectivity a network suited to the site, with backup connectivity where needed.
- Central supervision time series, events, alerts and target-system integration.
- Result measurement comparison of operation before and after intervention.
What can drive payback?
Payback depends on the network’s initial condition, the number of measurement points and the actual intervention. The figures below are indicative scenarios, not verified customer results or committed savings.
Indicative examples and their assumptions
| Area | Baseline assumption | Indicative example |
|---|---|---|
| Water loss | Approx. 5 million m³ supplied annually; a 3–5 percentage-point reduction in water loss | 150–250 thousand m³/year recovered; 1.5–2.5-year payback with 25–35 measurement points |
| High-consumption sites | 40–60 consumption sites | Approx. 600 avoidable site readings/year; 2–3-year payback |
| Pressure | Average zone pressure can be reduced by 1 bar | 10–15% lower leakage and 20–30% fewer pipe bursts; 1–2-year payback |
| Remote supervision | 30–50 supervised sites | Shared infrastructure and fewer inspection visits; 2–3-year payback |
| Energy | Approx. 4 GWh annual pumping-energy demand | 8–12% lower energy demand; 2-year payback |
These ranges cannot be applied to a specific network without a site assessment and cost calculation.
Where joint planning begins
- Which operational issue is most urgent: water loss, pressure, meter reading, supervision or energy?
- Where are the metered districts, critical supply points and existing measurement points?
- Which meters, controllers, protocols and communications networks can be used?
- What sampling and transmission frequency is required?
- Who is authorised to handle alerts, change setpoints and approve interventions?
- Which SCADA, GIS, billing and enterprise systems require integration?